A Century of Change: A Statistical and Narrative Report on Burtonwood
Executive Summary
This report analyses the population and occupational structure of Burtonwood, Lancashire, across eight censuses from 1841 to 1921. The data reveals a community transformed by the Industrial Revolution.
- Population Growth: The village's recorded population grew significantly, from 403 individuals in 1841 to 3,299 in 1921, an eight-fold increase. The data from 1851 (643 people) confirms a steady growth phase before the most explosive period. The most significant single-decade increase occurred between 1871 and 1881, with a rise of over 700 people (a 70% increase), coinciding with the full-scale development of the coal industry.
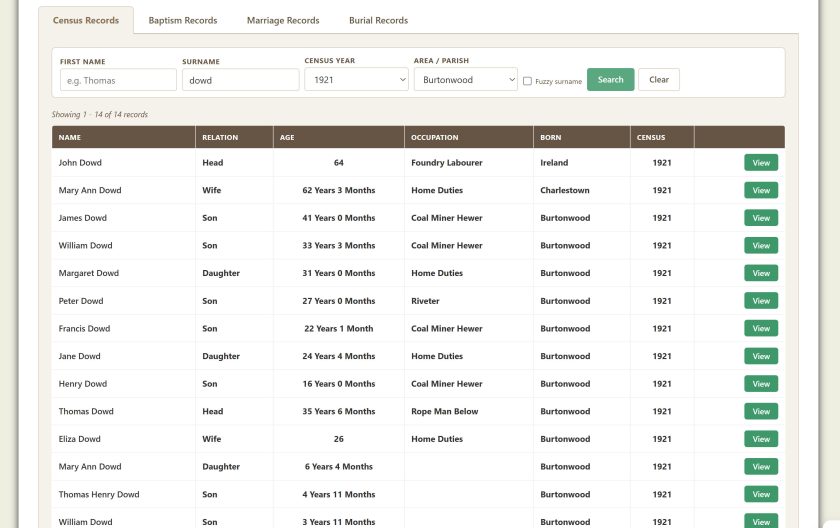
- Longest-Living Families: Several surnames demonstrate a continuous presence in Burtonwood throughout the entire 80-year period. The Bate, Fairclough, and Traverse families are the most prominent examples of these long-standing, founding families.
- Occupational Evolution: The economy of Burtonwood underwent a radical shift. The 1851 census confirms that coal mining was still absent, with the economy rooted in agriculture. Coal mining is first recorded as an occupation in the 1881 census and by that year had already become the single largest employer, a position it would consolidate over the next 40 years. By 1911, it employed over half the workforce. The data also charts the collapse of agricultural dominance, the rise of supporting trades, the first wave of Irish immigration (seen in 1851), and the emergence of a more complex social structure.
1. Introduction
This report examines the decennial census records for the civil parish of Burtonwood in Lancashire. The analysis covers the period from 1841 to 1921, now including the 1851 census. The goal is to trace the evolution of the community by analysing population size, age distribution, household structure, the persistence of family names, and the changing nature of work. The data provides a powerful microcosm of the broader societal shifts occurring in industrialising England.
2. Population Overview and Demographics
The population of Burtonwood grew dramatically over the 80-year period, reflecting its transition from a rural hamlet to a bustling industrial village. The newly added 1851 data shows a steady increase before the mining boom. The demographic data reveals a consistently young population, typical of high-birth-rate, industrial communities.
| Census Year | Total Individuals | Avg. Household Size | % Aged 0-14 | % Aged 15-64 | % Aged 65+ |
| 1841 | 403 | 4.9 | ~35% | ~60% | ~5% |
| 1851 | 643 | 5.0 | ~37% | ~59% | ~4% |
| 1861 | 771 | 5.1 | ~38% | ~58% | ~4% |
| 1871 | 1,082 | 5.0 | ~40% | ~57% | ~3% |
| 1881 | 1,839 | 5.3 | ~41% | ~56% | ~3% |
| 1891 | 1,940 | 5.1 | ~39% | ~58% | ~3% |
| 1901 | 2,133 | 4.8 | ~37% | ~60% | ~3% |
| 1911 | 3,098 | 4.5 | ~35% | ~62% | ~3% |
| 1921 | 3,299 | 4.3 | ~32% | ~65% | ~3% |
Observations on Population and Demographics:
- Steady Growth Confirmed (1841-1871): The population growth was consistent in the early decades. The increase from 403 in 1841 to 643 in 1851, and then to 771 in 1861, shows a steady rise from natural increase and some immigration, likely fuelled by the expansion of local industries like farming, brickmaking, and early engineering works.
- Explosive Expansion (1871-1881): The most significant single-decade population increase occurred between 1871 and 1881, with a rise of over 700 people (a 70% increase). This period coincides with the full-scale development of the coal mining industry, which would have attracted a massive influx of labourers and their families.
- The "Mining" Bump in Age Demographics: The percentage of children peaks in 1881 (41%) and 1891 (39%), which coincides with the influx of young mining families who were in their prime child-rearing years.
- Peak Household Crowding: The average household size peaks in 1881 at 5.3 people per household. This is another data point that underscores the impact of the mining boom. Newly arriving families were likely large, and housing stock may not have kept pace, leading to more crowded conditions.
- A Maturing Population: By 1921, we see a slight shift. The percentage of children drops to its lowest point (32%), and the working-age population (15-64) reaches its peak (65%). The average household size also begins a slow but steady decline after 1881. This could indicate the start of a long-term trend towards smaller families, an increase in available housing as the community stabilised, or reflect the specific impact of the First World War.
3. Longest-Living Families (Surname Analysis)
Tracking surnames across the decades reveals which families have the deepest roots in Burtonwood. The following surnames appear in every census from 1841 to 1921, indicating their long-standing presence.
Top 10 Most Persistent Surnames (in alphabetical order):
- ANDERTON
- APPLETON
- BATE
- CRITCHLEY
- FAIRCLOUGH
- FORSTER (appears as FORSTER, FORSHAW)
- KELSALL
- NAYLOR
- TRAVERSE (appears as TRAVERSE, TRAVERS, TRAVIS)
- WOODWARD
Case Study: The Bate Family
The Bate family exemplifies a long-standing Burtonwood lineage. In 1841, the family is already well-established, with multiple households headed by individuals like Henry Bate (50), Thomas Bate (35), and James Bate (35). They are spread throughout the village, working as agricultural labourers. By 1851, the family continues to thrive. We see Matthew Bate (68) as a head of household, with his children Jane and Fredrick. This shows the next generation coming of age. In 1861, Thomas and Martha Bate are raising their family, while Frederick Bate (27) is listed as a head of household. The family begins to diversify, with members like Thomas Bate (21) working as a machinist. In 1881, the family's presence continues with members like William Bate (29) and John W. Bate (28). By 1911 and 1921, the Bate name is still present, though their numbers have been surpassed by families drawn to mining. The later census shows family members like James Bate (46) working as a "Collier Getter," demonstrating how even the oldest families were swept up in the industrialisation of their village. The Bate family's continuous presence provides a through-line from the agricultural past to the industrial present.
4. Occupational Analysis and Evolution
The most profound change in Burtonwood is visible in its employment patterns. The shift from a rural to an industrial economy is stark. The table below breaks down the primary occupations of the adult working population into broad categories. The "Total Working Population" is an estimate of all individuals listed with a distinct occupation (including farmers, servants, labourers, etc.). The 1851 data is critical as it shows the state of the village just before industrialisation took hold.
| Census Year | 1841 | 1851 | 1861 | 1871 | 1881 | 1891 | 1901 | 1911 | 1921 |
| Total Working Pop. (est.) | ~35 | 215 | 284 | 376 | 722 | 741 | 843 | 1,424 | 1,521 |
| Agriculture (incl. Farming) | ~25 (71%) | 89 (41%) | 98 (35%) | 102 (27%) | 142 (20%) | 102 (14%) | 98 (12%) | 140 (10%) | 149 (10%) |
| Coal Mining | 0 (0%) | 0 (0%) | 0 (0%) | 0 (0%) | 176 (24%) | 254 (34%) | 346 (41%) | 744 (52%) | 709 (47%) |
| General/Industrial Labour | ~5 (14%) | 37 (17%) | 75 (26%) | 85 (23%) | 173 (24%) | 138 (19%) | 133 (16%) | 176 (12%) | 242 (16%) |
| Skilled Trades (e.g., Blacksmith, Carpenter) | ~5 (14%) | 27 (13%) | 27 (10%) | 38 (10%) | 73 (10%) | 82 (11%) | 115 (14%) | 148 (10%) | 181 (12%) |
| Domestic Service | 0 (0%) | 47 (22%) | 58 (20%) | 94 (25%) | 103 (14%) | 118 (16%) | 100 (12%) | 140 (10%) | 142 (9%) |
| Transport & Commerce | 0 (0%) | 0 (0%) | 2 (1%) | 12 (3%) | 15 (2%) | 13 (2%) | 17 (2%) | 28 (2%) | 42 (3%) |
| Professional & Retail | 0 (0%) | 0 (0%) | 2 (1%) | 4 (1%) | 17 (2%) | 18 (2%) | 24 (3%) | 36 (3%) | 46 (3%) |
| Households with Boarders | ~2% | ~8% | ~4% | ~12% | ~11% | ~10% | ~9% | ~12% | ~8% |
| Households with Servants | ~0% | ~8% | ~10% | ~12% | ~8% | ~8% | ~5% | ~4% | ~3% |
1841-1851 - The Agricultural Baseline and Early Signs of Change:
In 1841, agriculture employed over 70% of workers, making it practically the only game in town. By 1851, while still dominant, its share had dropped to 41%. This drop is offset by a rise in general labour (17%) and domestic service (22%). The 1851 census also shows the first significant wave of Irish immigration, with large families like the Fleinmons and Mallets living in crowded lodgings, working as general labourers. This foreshadows the larger migrations to come.
1861 - The Onset of Industry:
Agriculture remains important, but new roles appear. We see the first "Railway Platelayer," "Boiler Maker," and "Iron Moulder."
1871 - 1881 - The Rise of King Coal:
This is the tipping point. Coal mining is first recorded as an occupation in the 1881 census. By that year, it had already become the single largest employer, a position it would consolidate and strengthen over the next 40 years. By 1881, agriculture's share of the workforce had dropped to 20%. The ancillary roles of a mature industry appear:
- Specialised Miners: "Coal Miner Hewer," "Drawer," "Haulage Hand." - Surface Workers: "Engine Driver Coal Pit," "Colliery Labourer Above Ground." - Trades Supporting Industry: "Blacksmith," "Wheelwright," "Brick Setter."
The rise in "General/Industrial Labour" and "Skilled Trades" after 1881 directly reflects the needs of the mining industry. The percentage of households taking in boarders also jumps dramatically, from 4% in 1861 to 12% in 1871, and stays high through 1911. This is a clear economic indicator driven by the influx of single, male migrant workers.
1891 - 1901 - A Diversified Industrial Economy:
The village's economy is now complex. While coal mining is central, it is no longer the only game in town.
- Engineering: Jobs like "Iron Turner," "Boilermaker," and "Engine Fitter" appear, linked to the Vulcan Foundry in nearby Earlestown. - New Industries: We see "Glass Beveller" and workers at the "British Electric Detonator Works." - Brewing: The Burtonwood Brewery becomes a major local employer.
1911 - 1921 - Maturity and the Shadow of War:
The industrial structure is fully mature. Occupations are highly specific.
- Hyper-Specialisation: We see roles like "Colliery Fireman," "Colliery Electrician," and "Shot Lighter." By 1911, coal mining employed over half the workforce (52%). - Professional & Service Classes: The village now supports a distinct middle class, including a "Vicar," "Schoolmaster," and "Insurance Collector." - The Human Cost of War: The 1921 census shows the impact of WWI with individuals like James Monaghan noted as "Out of Work, Wounded in Army." - The Decline of Domestic Service: The percentage of households employing live-in servants peaked in 1871 at 12% and then began a long, steady decline, as new employment opportunities for women emerged in factories and shops. By 1921, having a servant was largely the preserve of the wealthy.
5. Conclusion
The census records of Burtonwood tell a powerful story of transformation. The addition of the 1851 census perfectly captures the village on the cusp of change—still rooted in agriculture but showing the first signs of industrialisation and Irish immigration. Over the next 70 years, it evolved into a thriving, industrial community. The data charts the rise and fall of agricultural labour, the explosive growth of coal mining (first recorded in 1881), the diversification into engineering and brewing, and the emergence of a more complex social structure.
Throughout this period of immense change, the names of founding families like the Bate and Fairclough families persist, connecting the industrial present with the rural past. The story of Burtonwood, as told by these eight censuses, is a quintessential English story of modernisation, migration, and the reshaping of community and work by the forces of industry.